LSD Windows Visual Guide


LMM (LSD Model Manager) is the integrated development environment (IDE) for LSD models and also the text editor for the associated equation files.

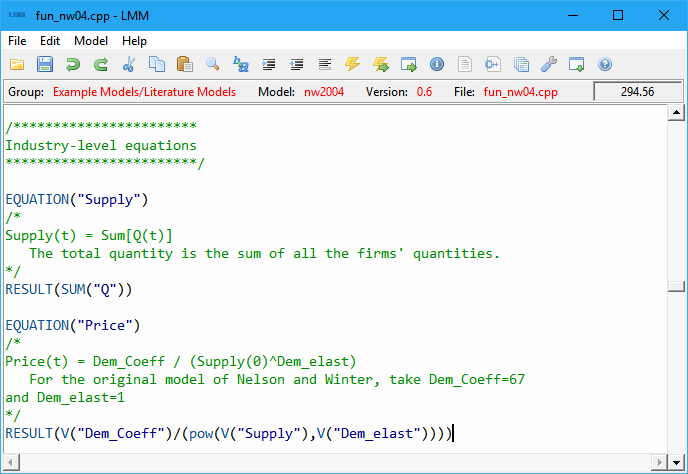
LMM offers full model management, including compilation, debugging and version control.

The Model Browser allows the organization of multiple LSD models in a hierarchical file structure. Models can be organized in a (inverted) tree of groups.

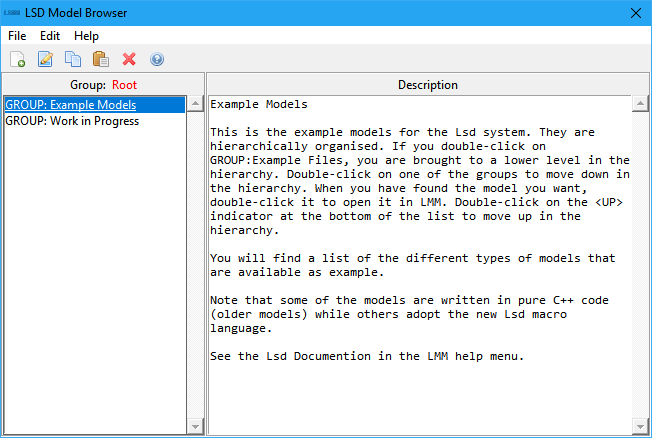
New groups and models can be easily created, including by copy-pasting (duplicating) existing models and groups.

The Browser window shows the content of one object of the model and functions as control center to give commands to the system.

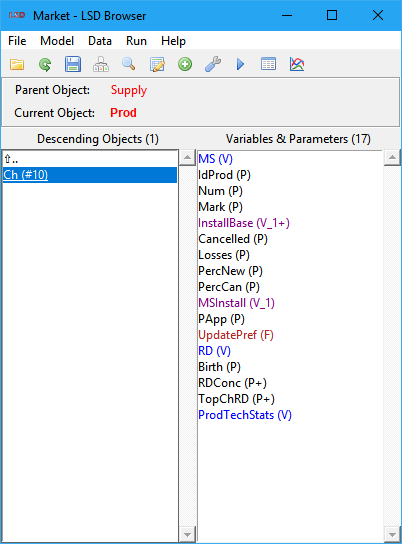
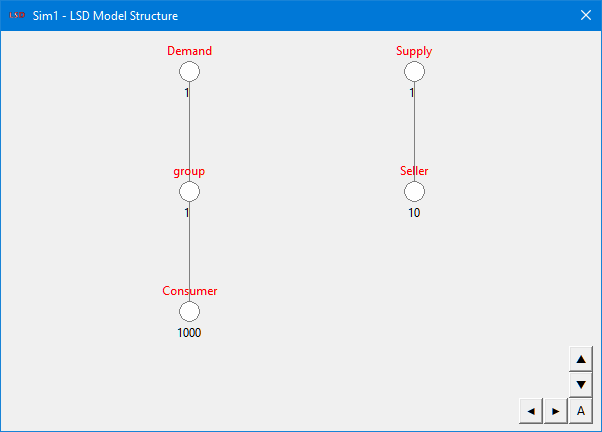
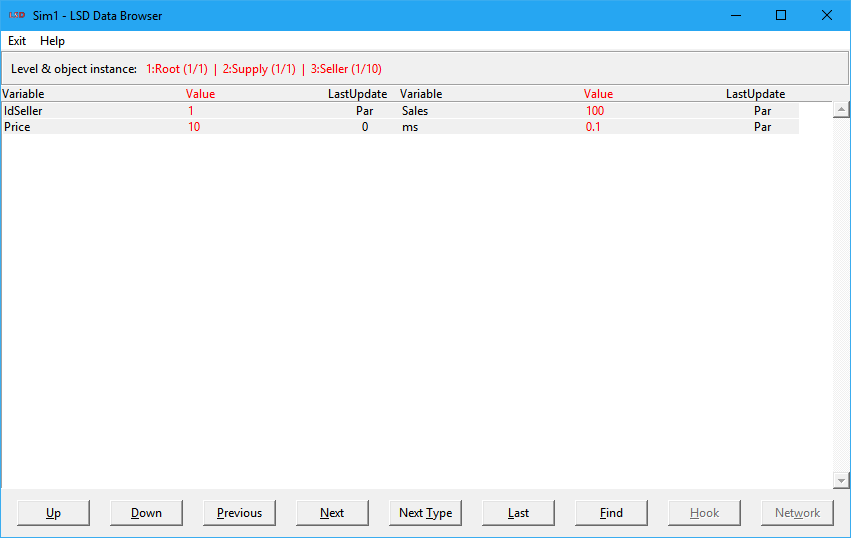
Clicking on the object labels move the browser to that object. Clicking on the variables’ and parameters’ labels allows the setting of the element’s options.

The Log window presents LSD messages to the user (e.g., error messages) and allows the program control during a simulation run, like activating the debugger or aborting the simulation.

When a model is loaded, this window provides a graphical representation of the Model Structure, and provides shortcuts to move the browser to that object.

This is the window for showing the Equation's code.

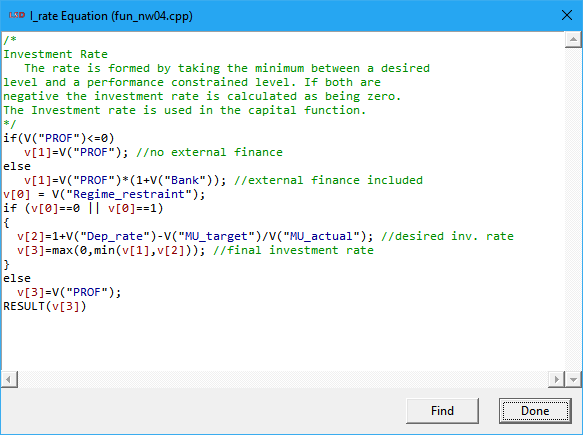
These windows show the code for a variable but cannot be used to modify the equations. Use LMM for this purpose.

The Initial Values window shows all, and only, the elements requiring an initialization.

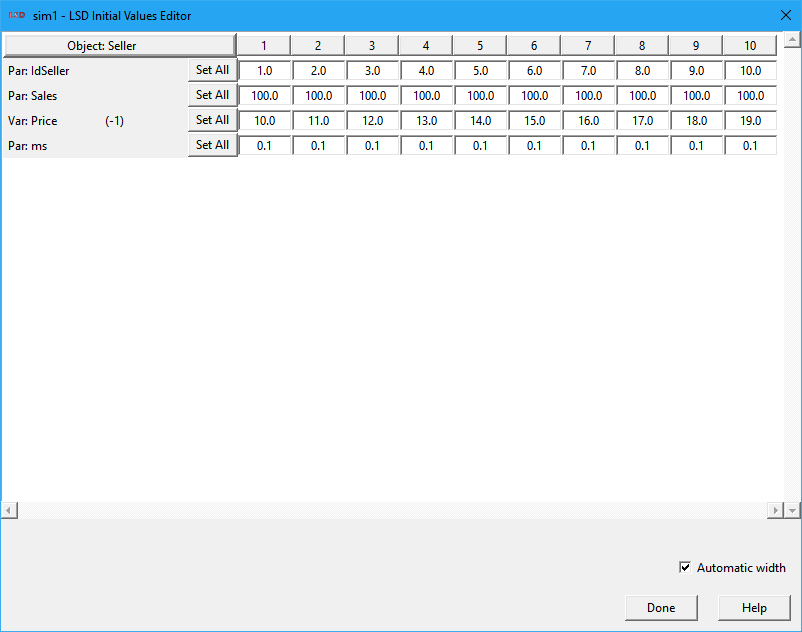
Each line concern a parameter or a lagged variable. Each column concern one copy of the object.

Such windows are generated for one type of object per time.

This is the window to set the Object Number shows all the copies of the objects in the model.

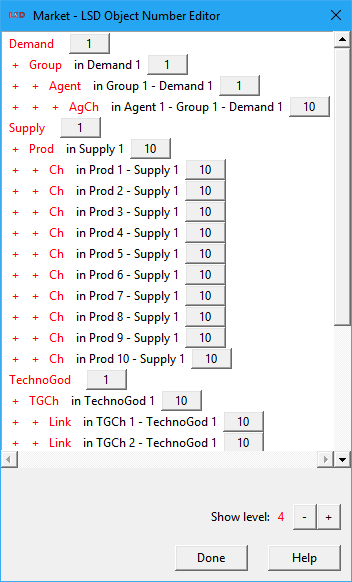
It is possible to modify the number of instances of groups of objects in a many ways, allowing the creation of complex configurations in a very simple way.

A Run-time Plot window is the time series graph of the values from some selected variables, plotted during a simulation run.

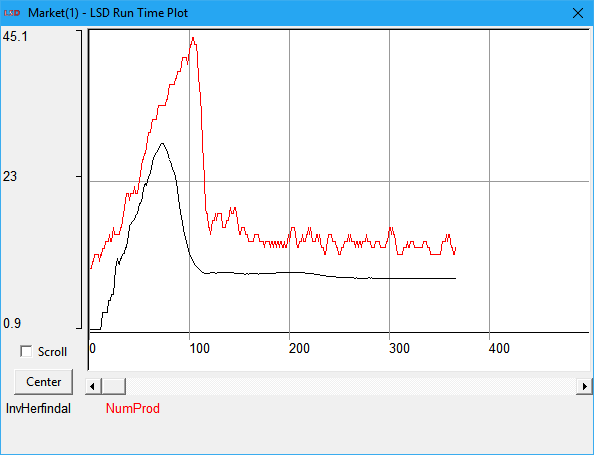
Variables to appear in the run time plot must be set before the simulation starts.

The Lattice window presents a bi-dimensional grid of points representing a subset of the current simulation run data.

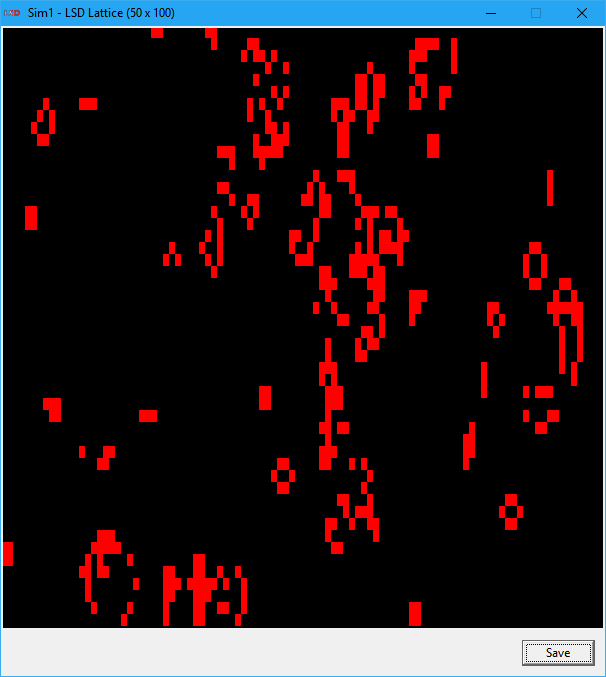
The interpretation of the lattice contents is model-specific, please refer to the model documentation for further information.

The Data Browser window shows the contents of the model, object by object.

Can be used before and after a simulation run, including for the modification of any value of the model.

The Debugger window shows the current state of a paused simulation and the contents of the model, object by object.

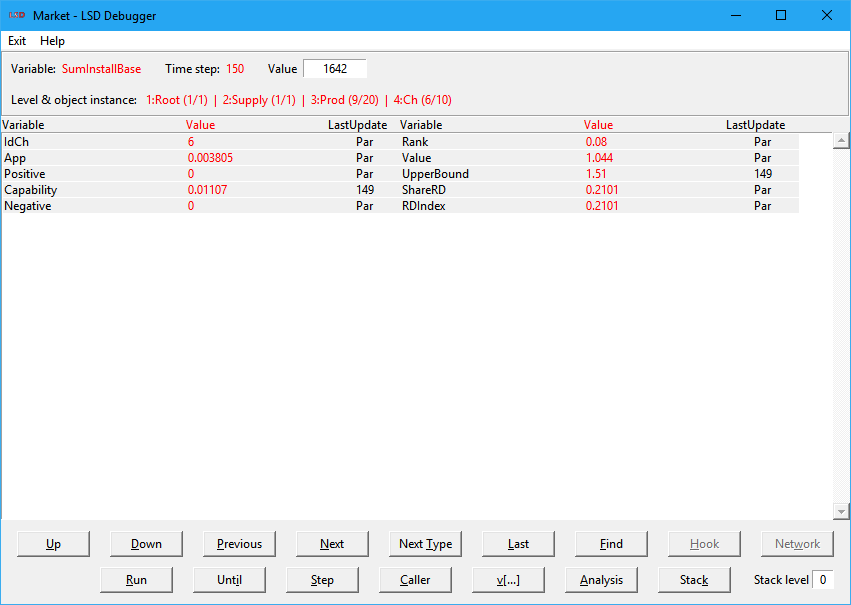
Can be used before, during and after a simulation run, modifying any value of the model.

Interruptions (breaks) can be set manually, at a given time step, or conditional to the value of variables.

The window of the module for the Analysis of Results allows the plotting of time-series and cross-section graphs from the selected series, produce descriptive statistics, and export data.

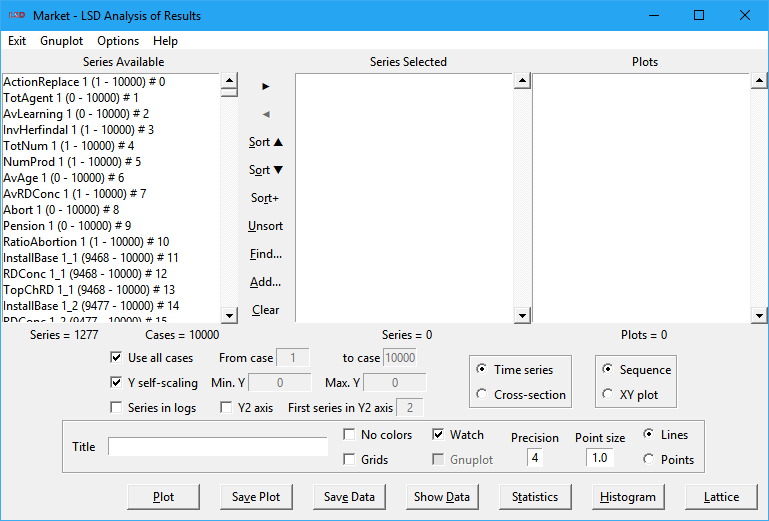
It is possible to use data from previous simulations and compare the final values of multiple simulations.


▲Top